 When I’m not blogging, you can often find me hanging around on Quora, the brilliant question and answer site …
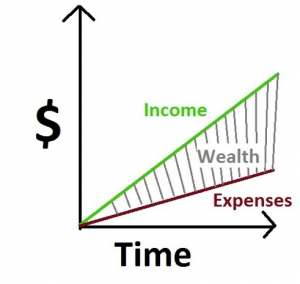
… and, that’s where I found Chris Han’s personal finance chart (to the left).
Chris says:
- Wealth is the shaded area in the diagram.
- You can increase the shaded area by increasing the slope of the green line, or by decreasing the slope of the red line.
- Decreasing the slope of the red line becomes significantly harder over time as you grow accustomed to your lifestyle.
Chris is right, but he needs to add a 4th bullet-point, and it’s the same observation that I made when I used a similar chart in this post to explain how businesses should manage their finances for growth:
4. Notice that it is easier to grow Wealth dramatically by increasing the slope of the green Income line than it is to decrease the slope of the red Expense line.
So, let’s break this down …
Regular personal finance will tell you to concentrate on the red (expense) line.
These authors will say that frugality, paying yourself first, and debt reduction (thereby, reducing your interest expense) will increase your wealth through the combined effect of:
– Decreasing expenses, and
– Time.
Decreased expenses allow you to save more, and time allows the full effect of compounding.
Voila! 40 years to fortune!
But, I think that you give up too much for too little, if you follow their advice:
First of all, you give up too many of life’s little pleasures now for little-to-no-reward later (if you can’t afford the lattes now, you sure won’t be able to in retirement).
Next, you have to wait – hence work – for far too long.
Instead, you should focus on the line that they are missing: the green (income) line. If you take my advice, you will concentrate on:
– Increasing your income,
– Using that increased income to build up a larger investment pool, quicker,
– And, aim to get better returns (hence, even more income) through better – and, more leveraged (i.e. using even more debt) – investments
Of course, you can’t simply ignore expenses, but they are best kept in control through delayed gratification, which means:
– Waiting to make purchases; the more major, the longer you should wait, and
– Not increasing your lifestyle (hence expenses) as your income increases.
It is this combination – increased/reinvested Income and controlled/slow-growth Expenses – that can quickly create a huge wedge of Wealth.
This is a very useful chart … you will do well to remember it.


I think there’s another reason for focusing on the green line versus the red: your mindset. Focusing your energies on finding ways to shave expenses to the bone strikes me as an admission that you do not expect to earn more. Trying to increase your earnings requires confidence and ambition and a desire to better yourself.
It’s like being locked in a cage. You can either focus your energies on making yourself comfortable, or you can try to find a way to unlock the door. The former person may claim that he’s found happiness in accepting his situation, but the latter person admits that being in a cage sucks, and that true freedom consists of getting out.
And that’s what wealth really is- freedom. Security. Comfort. Not having to tell yourself that “being in a cage isn’t so bad.”
It’s a nice looking chart – unfortunately, it’s not correct as it ignores the contribution to wealth that comes from investing the difference between income and expenses.
I do agree that increasing income is a better strategy than reducing expenses although doing both is not a bad idea either (especially when trying to scrape together the money for the first few investments).
Cheers
traineeinvestor
@ Milton- I like the cage analogy.
@ TraineeInvestor – Just like the business version of this chart, the ‘wedge’ is actually Capital; it’s how you use it that will really dictate your eventual Wealth.
Pingback: Principled Money Posts #29: karate, writing challenge and awesome writing : The Money Principle
This reminds me a lot of something I learned in an advanced business finance class:
Spend the first day of the month to watch your expenses, and the last 28-30 on your revenues.
Basically, just as the graph shows, spend the majority of your time making money, and less monitoring it. Eventually, you’ll have enough.
“Spend the first day of the month to watch your expenses, and the last 28-30 on your [income].”
@ Jason – That’s very good advice for business … and, for life!
Another excellent post!
Reducing your tax burden is another way to both reduce expenses and boost income. This results in more area under the curve.
I deal in real estate so every year I look to maximize my returns. Here are a two examples: renting an office to my business (40k/yr) and using cost segregation on a commercial building (166k savings over 5yrs).
Now I’m all for paying taxes. I just don’t want to pay more than I have to!
Pingback: Dealing with debt: ratios and strategies
Pingback: Your Entire Financial Life in One Deceptively Simple Chart | PFS
Pingback: What’s an eco-friendly standard of living?- 7million7years
Increasing income is confirm a better strategy than reducing expenses. This is so true. Thanks for sharing this post. Great efforts.